admin
admin
Here, I will be going over how we can make a custom Radar/Spider/Kiviat Chart for use within Flex applications since it is not included in the Flex charting components out of the box. We’ll be seeing a couple of rather out of the ordinary things here: drawing graphics and using trigonometric functions to determine layout.
So, first things first, we’ll need to define a few data classes we’ll be using to store the information about our Radar chart. What are the things you think for charts? Simple: Axes, Series and Values within the series. So those are the first classes we’ll define: Axis, Series and SeriesAxisValue.
First up, is the Axis:
public class Axis
{
  public var name:String;
  public var numberOfTicks:Number;
  public var tickMultiplier:Number;
}
Pretty simple class, right? All we are doing is creating a place where we can store the name of our Axis, the numberOfTicks to display on the Axis and the tickMultiplier to determine the value for each consecutive tick mark. For instance, if tickMultiplier was set to 5, the first tick mark would have a value of 5, the second tick mark a value of 10 and so on.
Next we need to define the data we need for a Series:
public class Series
{
  public var name:String;
  public var color:uint;
  public var values:Vector. = new Vector.();

  public function getAxisValue(axisName:String):Number{
    for each(var seriesAxisValue:SeriesAxisValue in values){
      if(seriesAxisValue.axis.name == axisName)
        return seriesAxisValue.value;
    }
    return 0;
  }

  public function getAxis(axisName:String):Axis{
    for each(var seriesAxisValue:SeriesAxisValue in values){
      if(seriesAxisValue.axis.name == axisName)
        return seriesAxisValue.axis;
    }
    return null;
  }

  public function addAxisValue(axis:Axis, value:Number):void{
    var seriesAxisValue:SeriesAxisValue = new SeriesAxisValue();
    seriesAxisValue.axis = axis;
    seriesAxisValue.value = value;
    values.push(seriesAxisValue);
  }
}
In this class, we are storing the name of the series, the color of the series, and the value of the Series for each Axis. In addition we have a few convenience methods.
getAxisValue – Gets the value of this series by Axis name, so we know where the series is going to intersect the axis.
getAxis – Simply returns an Axis object based on the name passed in
addAxisValue – Sets the value of this series by Axis, so we know where the series is going to intersect the axis.
We see in the Series Class above that we are making reference to a SeriesAxisValue object. That object looks like so:
public class SeriesAxisValue
 {
 public var axis:Axis;
 public var value:Number;
 }
This is the simplest class so far. All we are doing is storing an Axis and a value so that we can quickly determine what value we need to draw from what axis.
Now, on to the meat of this cookbook: the actual chart. Since the charting class is a few hundred lines long I will hit upon the important points of this class and leave the full source enabled on the example. This class, called RadarChart, which extends UIComponent accomplishes a few tasks:
- Drawing out the Axes along the correct angles
- Drawing out the tick marks and values upon the axis
- Drawing out the series to interset each axis at the desired value
All of these actions will be performed as a result of the updateDisplayList method being called. Here is that method:
protected override function updateDisplayList(unscaledWidth:Number, unscaledHeight:Number):void {
  if(redraw){
    redraw = false;
    //Set needed properties for the drawing process
    _middle = new Point(unscaledWidth/2, unscaledHeight/2);
    _radius = (Math.min(unscaledWidth, unscaledHeight)/2);
    _axisLabelSpacerSize = isNaN(getStyle("axisLabelSpacerSize")) ? 0 : getStyle("axisLabelSpacerSize");

    //Draw the background and border of this chart
    var g:Graphics = graphics;
    g.clear();
    g.beginFill(getStyle("backgroundColor"), getStyle("backgroundAlpha"));
    g.lineStyle(getStyle('borderThickness'), getStyle('borderColor'), getStyle('borderAlpha'));
    g.drawRect(0, 0, unscaledWidth - getStyle('borderThickness'), unscaledHeight - getStyle('borderThickness'));
    g.endFill();

    //Draw center dot of the chart
    g.beginFill(getStyle("centerColor"), getStyle("centerAlpha"));
    g.lineStyle(0);
    g.drawCircle(_middle.x, _middle.y, getStyle("centerRadius"));
    g.endFill();

    //Draw the axes and series to complete the chart
    drawAxes();
    drawSeries();
  }
  super.updateDisplayList(unscaledWidth, unscaledHeight);
}
The first thing this method is doing is setting some class variables so that they can be used throughout our drawing methods. We are setting:
- _middle – A point representing the exact middle of our chart which has an x value of half of the width and a y value of half of the height. This assumes our chart will be a square.
- _radius – A number representing radius of our chart, or simply half of the height or width of the chart.
- _axisLabelSpacerSize – A number representing how much space we will need to leave between the end of our axes and the edge of the component to fit our axis names. This is determined by a style set on the component.
Next, since we’re using a UIComponent and aren’t satisfied with plain white backgrounds, we need to draw a background to our component. To do that we follow the operations:
- Get the graphics object
- Setup a fill using the backgroundColor and backgroundAlpha styles
- Setup a lineStyle to be used as a border using the borderThickness, borderColor, and borderAlpha styles
- Draw a rectangle around the component which will have our background and border.
Next, we need to draw the center dot on our radar chart. We follow similar steps abouve of defining our fill, setting the linestyle and then drawing a circle in the middle of the component.
Lastly, we invoke drawAxes() which, clearly, will draw the axes nad drawSeries() which will draw the Series. First, let’s look at draw axes:
private function drawAxes():void {
  var axisAngle:Number = (2*Math.PI) / _axes.length;
  var angle:Number = 0;

  for each(var axis:Axis in _axes) {
    var start:Point = new Point(
      _middle.x + Math.cos(angle) * 3,
      _middle.y + Math.sin(angle) * getStyle("centerRadius")
    );

    var stop:Point = new Point(
      _middle.x + Math.cos(angle) * (_radius - _axisLabelSpacerSize),
      _middle.y + Math.sin(angle) * (_radius - _axisLabelSpacerSize)
    );

    drawAxis(start, stop);
    addAxisLabel(axis, angle);

    drawTickMarks(angle, axis.numberOfTicks, axis.tickMultiplier);
    angle += axisAngle;
  }
}
Let’s walk through this method. We determine an axisAngle which is the angle between each axis and then we set our starting angle to 0. We then loop over each axis and determine it’s start point form the center and it’s stop point which is the end of the axis(this uses a bit of trigonometry like radius, angle, sine and cosine. I won’t give a Math lesson here.). These are the points we’ll use to draw our complete axes. The draw axes method simply uses the graphics object to draw a line between the points similar to how we were drawing rectangles and circles above.
The addAxisLabel method is rather lengthy for the simple task it accomplishes, so I’ll only explain it’s purpose here and let you view the full source for more details. The addAxisLabel method use some more trigonometry to find a point which is at the end of the axis, but adjusted so that the label is centered and right-side-up. Is uses the “name” attribute on the axis to populate the label.
The drawTickMarks method is also rather lengthy so I will only explain it’s purpose here and let you view the full source for more details. drawTickMarks uses trig yet again to find points on the axis for each tick mark to be drawn. The tick mark length style is then used to determine how long a line and at what angle it will need to be drawn on the axis.
Now we have our Axes drawn! Now we need to move on to the drawSeries method to complete our chart. It’s a bit simpler than drawing the axes:
private function drawSeries():void{
  for each(var series:Series in _series){
    drawSeriesPoints(series);
    drawSeriesFill(series);
  }
}
Here, we’re looping over all of our series and drawing points correxponding to each SeriesAxisValue and then drawing a fill polygon to connect the points with lines and fill in the area in between with a slightly shaded region. We’ll only look at the drawSeriesPoints method since these methods are interacting with data similarly:
private function drawSeriesPoints(series:Series):void{
  var axisAngle:Number = (2*Math.PI) / _axes.length;
  var angle:Number = 0;
  var g:Graphics = graphics;
  g.lineStyle(2, series.color, 1);
  g.beginFill(series.color, .4);
  for each(var axis:Axis in _axes) {
    var seriesAxisValue:Number = series.getAxisValue(axis.name);
    var point:Point = new Point(
      _middle.x + Math.cos(angle) * (_radius - _axisLabelSpacerSize) * seriesAxisValue/axis.numberOfTicks/axis.tickMultiplier,
      _middle.y + Math.sin(angle) * (_radius - _axisLabelSpacerSize) * seriesAxisValue/axis.numberOfTicks/axis.tickMultiplier
    );
    g.drawCircle(point.x, point.y, 3);
    angle += axisAngle;
  }
}
Above, we are first getting the angle between all of our axes and then setting out starting angle to zero. We then initialize a line and fill so that we may use it to draw circles at each point we determine. To determine those points, we loop over each axis, get the series value for that axis and determine the point using trig and our value. Once we have that point we draw a circle there, end the fill to fill in the circle and move on to the next axis.
After all of the points are drawn, the drawSeriesFill method would be called to draw lines between the points and fill in the enclosed area.
With all of the methods I’ve shown and described in this class and a little boilerplate skeleton code to hold it all together (viewable in ‘view source’ on the demo below) you should have a fully functional rader chart component. Now we just need to see how we can use it in flex mxml:
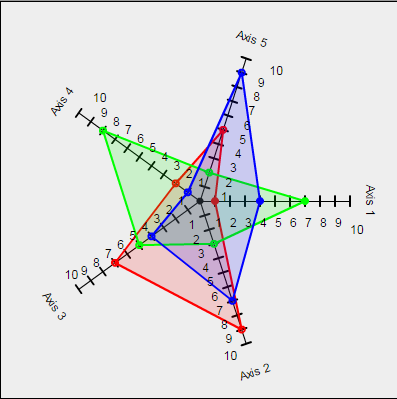
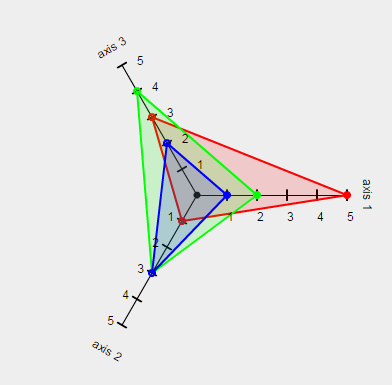
<local:RadarChart width="400" height="400" backgroundColor="0xEEEEEE" borderColor="0x000000" borderThickness="2"
 backgroundAlpha="1" centerColor="0x000000" centerRadius="3" centerAlpha="1" axisLabelSpacerSize="50"
 tickMarkLength="10" tickMarkColor="0x000000" tickMarkAlpha="1">
  <local:axes>
    <fx:Vector type="Axis">
      <local:Axis id="axis1" name="Axis 1" numberOfTicks="10" tickMultiplier="1"/>
      <local:Axis id="axis2" name="Axis 2" numberOfTicks="10" tickMultiplier="1"/>
      <local:Axis id="axis3" name="Axis 3" numberOfTicks="10" tickMultiplier="1"/>
    </fx:Vector>
  </local:axes>
  <local:series>
    <fx:Vector type="Series">
      <local:Series color="0xFF0000">
        <local:values>
          <local:SeriesAxisValue value="1" axis="{axis1}"/>
          <local:SeriesAxisValue value="9" axis="{axis2}"/>
          <local:SeriesAxisValue value="7" axis="{axis3}"/>
        </local:values>
      </local:Series>
      <local:Series color="0x00FF00">
        <local:values>
          <local:SeriesAxisValue value="7" axis="{axis1}"/>
          <local:SeriesAxisValue value="3" axis="{axis2}"/>
          <local:SeriesAxisValue value="5" axis="{axis3}"/>
        </local:values>
      </local:Series>
      <local:Series color="0x0000FF">
        <local:values>
          <local:SeriesAxisValue value="4" axis="{axis1}"/>
          <local:SeriesAxisValue value="7" axis="{axis2}"/>
          <local:SeriesAxisValue value="4" axis="{axis3}"/>
        </local:values>
      </local:Series>
    </fx:Vector>
  </local:series>
 </local:RadarChart>
Above we see a few things:
- We define a RaderChart component which defines most of the styles that we saw utlized in our drawing code.
- We define a list of Axes where each defines its name, numberOfTicks and TickMultiplier.
- We define a list of series where each have a color and a list of SeriesAxisValues containing references to the Axes and values.
That’s it! With that we have defined a RadarChart component and invoked it!
Below, you can see a demo utlizing this code and the full source by right clicking the demo and selecting “View Source”.